Visualise Success with Advanced Data Dashboards
Turn Data into Visual Stories that Drive Decision-Making
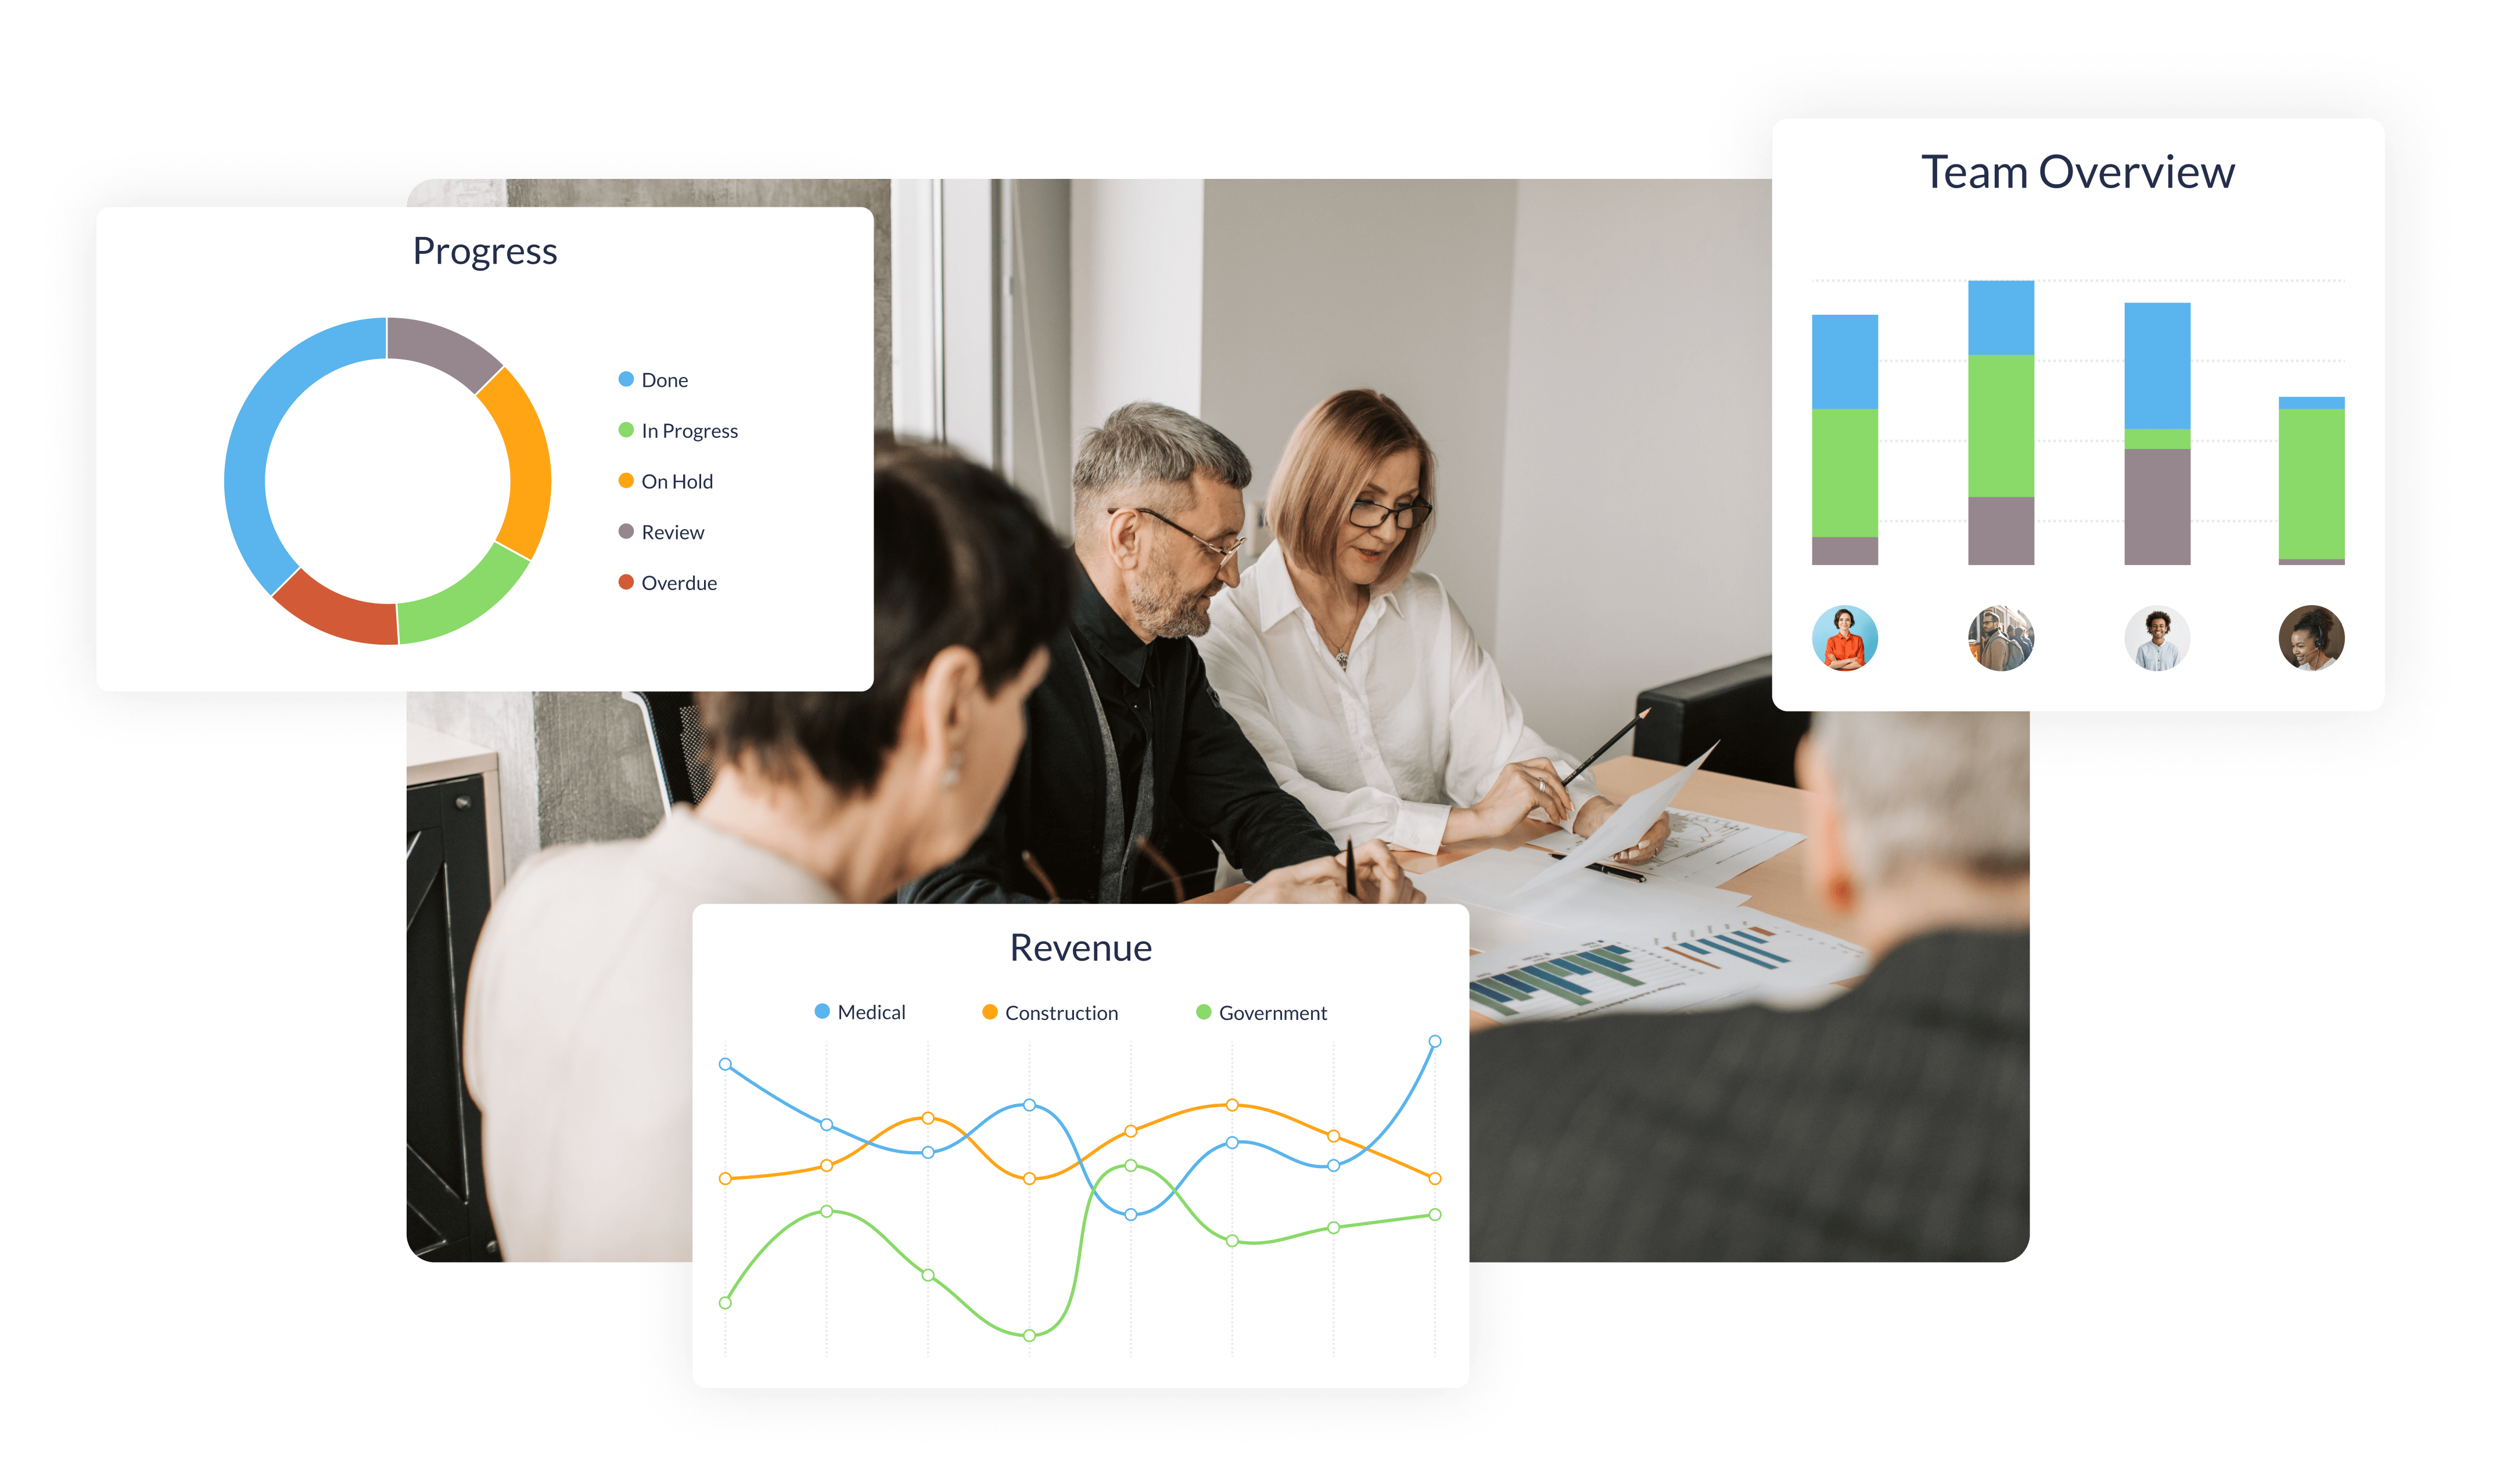
Empower your Decision-making with Data Visualisation
Interactive Data Visualisation
- Customisable Dashboards: Tailor your data visualisation dashboards to reflect the metrics that matter most.
- Real-Time Data Representation: Visualizse data as it's being updated in real-time.
- Variety of Visualisation Tools: Choose from charts, graphs, heat maps, and more to represent your data.
User-Friendly Interface
- Quick and Simple: Easily create and customize dashboards without needing coding skills.
- Intuitive Design: A clean, straightforward layout that makes navigation and understanding data effortless.
Insightful Data Analytics
- Data Storytelling: Present data in a narrative form to make complex insights understandable.
- Predictive Analytics: Use data to predict trends and make proactive business decisions.
- Drill-Down Features: Explore data layers to understand the finer details and underlying patterns.
Advanced Data Dashboard Customisation:
Multiple Data Sources Integration: Within the platform, combine data from various sources into a single dashboard.
Theme and Layout Options: Customise the look and feel of your dashboards to align with your brand.
Conditional Formatting: Highlight key data points using colors and formats based on certain conditions.


Collaborative Tools and Data Sharing:
Shared Dashboards: Collaborate with team members by sharing dashboards.
Export and Import Functions: Easily export dashboards for presentations or reports, and import data for quick dashboard creation.
Comments and Annotations: Add context to your data with notes and comments directly on the dashboard.
Data Filtering and Manipulation Platform:
Dynamic Filters: Apply various filters to focus on specific data segments.
Data Aggregation and Disaggregation: Group data for high-level overviews or break it down for detailed analysis.
Data Slicing and Dicing: Manipulate data to examine it from different angles and perspectives.


Interactive Reports and Presentations:
Interactive Elements: Engage stakeholders with dashboards that allow interaction, like clickable elements or hover details.
Storyboards: Create a narrative with your data using sequential dashboards that tell a story.
Automated Reporting: Set up automatic generation of reports based on your dashboards at regular intervals.
Hear it From Our Clients

Owen Pugsley
Corporate Events & Marketing manager, Prostate Cymru

Adam Rice
Technical Director, H2OIQ

Nick Lane
Founder & Chief Insight Analyst, Mobilesquared
Designed for Enterprise, Loved by All


